Making smart maps

Making smart maps

Feckenham Wylde Moor by Paul Lane

Trainee Patrick explains how our conservation work can be enhanced through the use of technology...

As conservation trainees, reserves team leader Rob encourages us all to take on our own “project”. After several experiences of GIS (Geographical Information Systems) and coming from a technological background in a previous life, I decided to use the traineeship to expand my knowledge of GIS, which has become an increasingly important tool in recording and monitoring species and habitats on nature reserves and the wider countryside.

"What is 'GIS'?" I hear you ask! GIS is software that allows us to add multiple layers of information on to a base map. The three most common types of layers are:

  • Point layers - these refer to single-point features such as trees, buildings, gates or points where a particular species was recorded
  • Line layers – these are linear features such as hedges, rivers or footpaths
  • Polygon layers – these are used for complex shapes such as areas of habitat, or reserve boundaries

Each layer is associated with a table of data. For example, if I add a point layer showing the position of trees, each line of data represents an individual tree and the columns contain information such as species, date surveyed, girth and OS Grid Reference. To help identify different points at a glance, the software then allows the colour or shape of the points to change according to the data, so an oak could be green and an ash could be red - however, the possibilities are almost endless. Equally, the tables can be exported to an Excel spreadsheet for further analysis. That’s probably enough technicalities for now! 

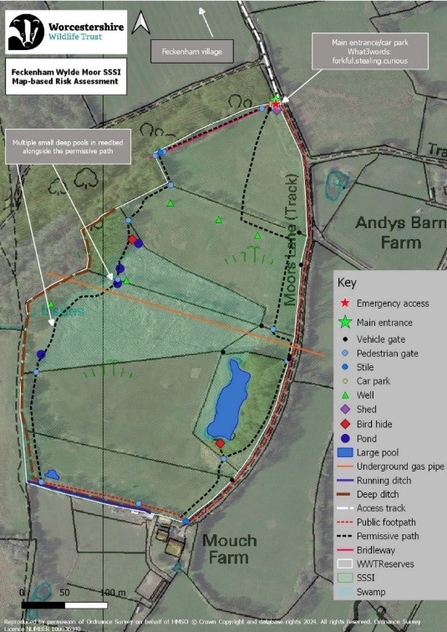
A risk assessment map of Feckenham Wylde Moor nature reserve

A risk assessment map of Feckenham Wylde Moor nature reserve

I gained some experience with GIS as part of my Conservation Management course, during a brief placement with the reserves team in 2020. Rob introduced me to QGIS, a free package used by many conservation organisations. Rob had an idea that when a contractor works on a nature reserve, the multiple pieces of information required could be combined onto a single map-based risk assessment for the reserve. I helped to create the first one and, four years later, every reserve now has one!

Last winter, prior to the traineeship, whilst helping with the farm volunteers at Lower Smite Farm, I persuaded Jasmine from the wider countryside team to help me produce maps of the reptile surveys that were carried out in 2022. This involved manually plotting the position of each reptile mat onto a map of Lower Smite Farm and adding the data we collected to the attributes table for each point. I was then able to produce maps with points that varied in colour according to the number of slow-worms or grass snakes observed over the season.

A few months ago, I approached Jasmine again to discuss a trainee project. Jasmine came up with a couple of ideas and I have been working on both since.

Habitat mapping for Worcestershire Wildlife Trust nature reserves 

This involves using an online tool called Land App, which is a project to map the whole of the UK for all types of land management, including habitat mapping. The goal is to classify all land according to the new habitat classification system – UKHAB  (there is more information on this in my previous blog on learning new botanical skills). The Trust’s contribution to this is to map habitats on nature reserves. 

I started with a spreadsheet of the reserves in the Forest of Feckenham area. Initially I recorded basic habitat information from the reserves handbook, followed by more details of the important features from the SSSI citations – documents produced by Natural England that define why a site is classed a Site of Special Scientific Interest. I then moved onto the Reserve Management Plans and for some reserves, where I found very detailed botanical survey information. So the project quickly became a data search. I did some work on the map allocating land parcels to reserves but this was not going to provide much experience of GIS - therefore, we decided to look at the alternative project.

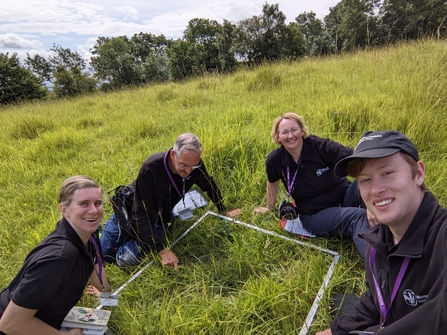
Four conservation trainees sat studying the botany of a field

Conservation trainees

Grassland monitoring using QGIS

Over the last couple of weeks, I have started to map Grassland Condition Monitoring data collected from several reserves during the summer. 

Briefly, the purpose of Grassland Condition Monitoring is to survey a meadow, say every five years, and assess its condition to see whether the reserve management is working. A defined set of one metre squares are surveyed against a set of parameters, such as sward length, presence of bare soil and the presence of favourable and unfavourable plant species. For the wet meadows at Feckenham Wylde Moor, favourable species include ragged robin, meadowsweet and cuckoo flower, whilst unfavourable species include common reed, creeping buttercup and horsetails, which will quickly dominate the sward to the exclusion of other species. These parameters may be different for every meadow, depending on the target habitat classification of the meadow.

I mapped out the survey points for Feckenham Wylde Moor, which completed that exercise for all the surveys, but I haven’t yet entered all of the associated data.

In the final weeks of my traineeship, I will be entering the data for all of the sites so that we can show any areas with a lower score in a different colour. We will then have a tested method of producing this data in preparation for the 2024 season of meadow surveys, which will no doubt involve the next set of trainees!

A long-standing naturalist, Patrick Taylor has taken the plunge and is loving the change of career from engineering to nature conservation.